Cities across the country have poured money into expanding light rail systems for several decades, with few achieving the success they had promised. While there are many reasons for the success or failure of each individual project, one of the most prominent reasons is the lack of connectivity between where people live and where people work. One system that has achieved this balance, on a small scale, is the Niagara-Frontier Transportation Authority’s (NFTA) Metro Rail, located in Buffalo, New York. With just over six miles of track, the system has a per mile ridership on par with many more transit rich cities throughout the country, and is advancing an expansion proposal that will further connect vital economic centers, finally completing what was once known as Phase One for metro. Buffalo’s metro expansion offers up an example of light rail transit that can both drive ridership and development along the corridor, something the city of Buffalo has recognized it needed for decades.
The Queen City
Buffalo’s long economic downturn obscures the immense prosperity that the region experienced for the first half of the Twentieth Century. Located at the western terminus of the Erie Canal, and on the eastern shore of Lake Erie, Buffalo was a central shipping hub connecting the East Coast with the Midwest. Millions of bushels of grain passed through the city’s ports every year, leading to the development of large grain mills along the shore. By the beginning of the Twentieth Century, Buffalo surpassed Minneapolis in terms of its grain output [1]. Ship building, steel and iron production, and meat packing plants quickly grew along with the city, which was one of the ten largest cities in the country at the turn of the century [2]. Buffalo would reach its peak population of over 580,000 residents in 1950 [1], the same year the last of the city’s original streetcars would end operations [3].
A shift away from shipping and towards the use of trucks and trains to move freight removed the geographic advantage the city enjoyed for over a hundred years [1]. In 1970, manufacturing accounted for over 35 percent of employment in the metropolitan region. By 2014 that share had dropped to around 10 percent, as manufacturing moved towards the south or internationally to find cheaper labor [4]. As the labor market changed, the demographics of the city changed with it. Since 1950, the population of the city has plummeted, losing over 100,000 people in the 1970s alone [1]. As of 2018, the population of Buffalo has stabilized around 256,000 residents, less than half of its peak population [5]. During this time of decline, the city began exploring ways to reinvigorate its urban core and connect its rapidly growing suburbs to downtown. By the late 1960s, a plan for a regional rail network had emerged as a desirable method of drawing investment back into the city.
The Original Metro Plan

Source: Forgotten Buffalo, “Metro Report: Niagara Frontier’s 1995 Transit System”
Governor Nelson Rockefeller [R] was an early supporter of the plan to bring rail transit back to the city of Buffalo, with an eye towards connecting the newly constructed SUNY University of Buffalo (UB) campus in Amherst with the downtown core [6]. A combination of federal and state funding was awarded to begin studying the proposed corridor, two-thirds of which came from the Urban Mass Transit Administration (UMTA). As planning evolved, NFTA was created in 1967 in order to bring all modes of public transportation in the Buffalo metro area under one roof, including the Port of Buffalo and the two international airports in the region [7]. By 1973, a proposal for an extensive regional heavy rail network was unveiled, titled “Metro Report: Niagara Frontier’s 1995 Transit System,” [7] laying the groundwork for the only major investment in rail transit in New York state outside of the New York metropolitan area.
Over the course of multiple phases the planned network would reach a total length of 46 miles, connecting Buffalo with its largest suburbs along with a line directly to Niagara Falls, New York. The first phase, known as the Blue Line, would run from Downtown Buffalo northeast to the SUNY UB North Campus in Amherst, the most populous suburb of Buffalo, almost entirely along the Main Street corridor, for a total of 12 miles. The route required the removal of 99 families, 78 businesses, and the acquisition of 130 structures, with plans to run service as frequently as every two minutes during peak periods with connections to bus routes at every station [7]. Phase Two would include a new line that headed directly north out of the city into the town of Tonawanda toward Niagara Falls, along with an extension of the Blue Line to the north and south. Future phases would look to expand into the metropolitan region including the Cheektowaga Corridor heading east, the Hamburg Corridor heading south, and the Richmond Corridor to the northwest [7].
A Need to Scale Back
As soon as the regional plan was published, hope for the ambitious network to be completed began to fade. Governor Rockefeller would leave the governor’s mansion to become the Vice President of the United States, removing the plan’s strongest ally in the state government. At the same time, the town of Amherst pulled support from the plan, citing concerns over mass transit bringing “urban ills” to their community, a devastating blow as one of the network’s major destinations, SUNY UB North Campus, is located within its borders [6].
Federal funding is key to the success of any transit plan of this scale succeeding, which proved to be the final blow to the initial ambitions of this network. Concerns over Buffalo’s shrinking size and economic downturn, coupled with the federal government’s new found reluctance to invest in public transit projects resulted in the project scaling back considerably [3]. Phase One was scaled back from a 12 mile route to just under 6.5 miles, ending at the city’s border at SUNY UB’s South Campus. Another major alteration was the switch from heavy rail to light rail, significantly reducing the cost of infrastructure along the route [6]. Even with this switch, the plan still called for amenities similar to heavy rail systems, such as raised platform boarding and prepaid fares. With these changes, UMTA agreed to fund the project in 1976 at an estimated cost of $336 million [8], eventually growing to $530 million ($1.24 billion today) [6].
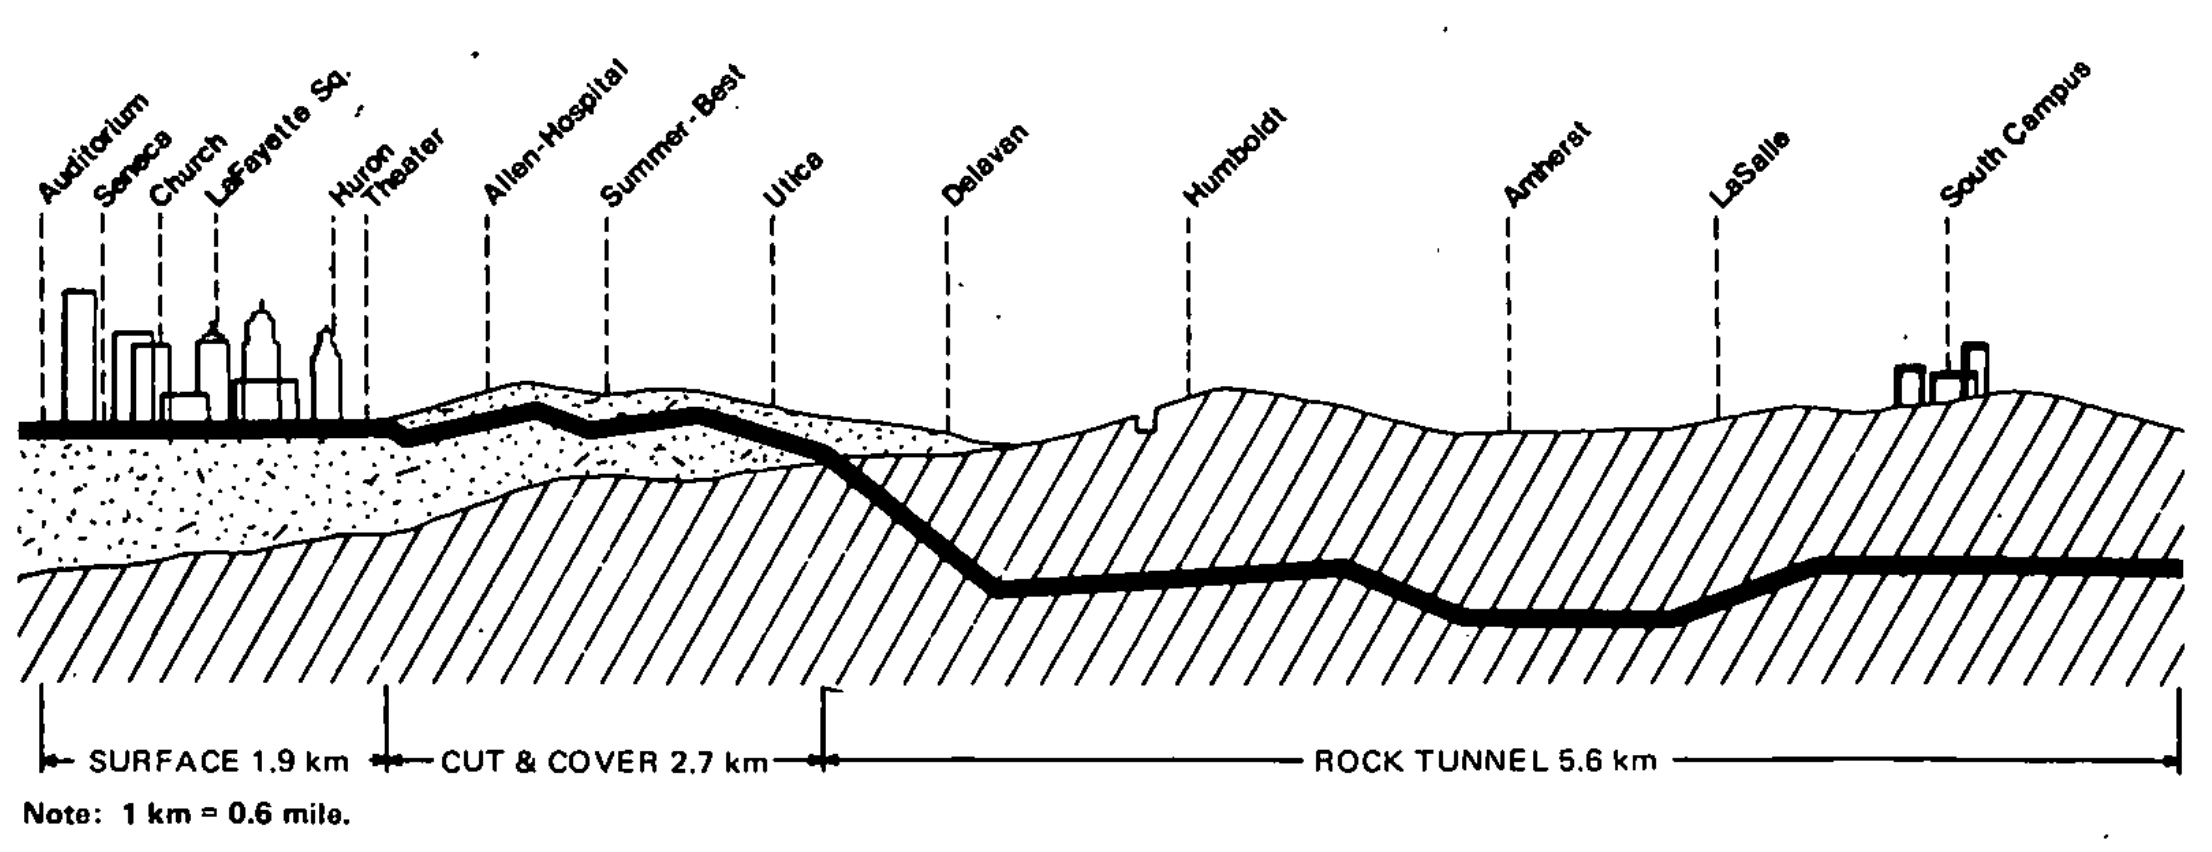
Source: Knight, Kenneth G. “Buffalo’s Light-Rail Rapid Transit System”
Construction began in 1979 with the downtown street level tracks opening to the public in 1984. This 1.2 mile stretch would operate as a transit mall and provide free service to those using the system at the six stations within this zone. The final 5.2 miles of track, all underground, would not be opened to the public until 1986, bringing the total length of the line to 6.4 miles [6]. Upon its grand opening, Rep. Henry J. LaFalce [D], of Tonawanda, believed the new system would only succeed if two extensions were added to the route [3]. Those extensions never came, and as a result this network remains one of the shortest lines in the country.
Current State of the Metro

Source: Mapa-Metro
Even with its shortened line, Buffalo’s metro has enjoyed healthy ridership throughout its existence, although it has experienced a gradual decline in ridership overall. In the early 1990s Metro Rail’s share of all transit usage in the region was around 25% [9], with ridership peaking in 1991 at 8.5 million annual riders [6]. Today Metro Rail accounts for around 17% of total ridership, with around 4.5 million annual riders. Even with this decline, the system functions with a higher per mile ridership than most light rail networks throughout the country, with just under 2,500 riders per mile, even when compared to cities many would deem transit rich, such as Portland [10].
Many factors contribute to the continued success of the network, including its connectivity and fare pricing, while the service hours may be a hindrance. Unlike many of the recent investments in light rail and streetcar systems, Buffalo’s Metro Rail successfully connects residential neighborhoods with some of the larger economic centers in the region, including Downtown Buffalo and two of the SUNY UB campuses, South and the medical campus. Within a 15 minute walk, riders are also able to reach many cultural destinations, such as the Buffalo Zoo, Delaware Park, and the Elmwood neighborhood, which is known for its local culture [9]. A flat fare system also benefits riders, with both buses and Metro Rail costing $2 per ride, with all day and monthly passes available, keeping it easy and affordable for most riders using the system. One thing that may be holding back some ridership numbers is service ending at 1am, even on the weekends. With bars and restaurants being open until 4am, an early service end may be preventing some from considering Metro Rail as a transit option on their night out [11].
While ridership is comparatively high, the original intent of the network, to boost economic development in the urban core, is only now starting to see some success. For over 40 years, Main Street through Buffalo has been emptying out, leaving vacant storefronts and buildings along the corridor. Over the last several years, Buffalo has followed the national trend of seeing reinvestment in central cities, with a large portion of the local investment coming from SUNY UB and its medical campus [6]. Due to the line’s central positioning, NFTA has seen this as an opportunity to capitalize on the reinvestment, looking for private partners to revamp some of its older, dated stations [6].
Not all of the new developments in Buffalo have been positive for Metro Rail. Over the last few years, the city has been reintroducing cars to Main Street, with a plan to completely revamp the downtown portion of the corridor in the next several years. The mayor of the city has touted this reintroduction of cars as an economic boon for the community, and believes it is a major reason for the reinvestment that has been occurring there [12]. This claim is tough to prove, when considering the overall momentum cities have experienced over that same period of time, but its effects on Metro Rail can be seen with falling on time performance [13]. This decreasing reliability impacts the mode choice of residents, while continuing to promote the use of cars over transit. Yonah Freemark writes in City Lab that, “Increases in transit use are only possible when the low costs of driving and parking are addressed, and when government and private partners work together to develop more densely near transit stations.” [14] This current action by the city, with support from Senator Schumer, has done the exact opposite in terms of promoting the use of transit within our central cities. At the same time, NFTA has been working to develop a plan for expanding Metro Rail into the suburbs to finally connect to SUNY UB North Campus, with full support from Governor Andrew Cuomo [D].
Expansion Plans

Source: NFTA Metro
New York State’s transportation funding formula does not take into account Buffalo’s unique position as the only community in Upstate New York to have rapid rail transit, leaving the system’s state funding on par with cities that only operate buses [15]. As a result, NFTA has been arguing in favor of expanded funding, pointing out that the proper maintenance of Metro Rail is vital in terms of gaining access to federal funding for capital programs in the region. As a response, the state awarded NFTA a $100 million grant to fund needed repairs and upgrades throughout the system including trackbed replacement, implementation of a new fare collection system, vehicle upgrades, and a new video surveillance system [16]. In 2017, Governor Cuomo announced Phase Two of the Buffalo Billion program, with $215 million going towards revitalization and smart growth programs. Around $5 million of that new funding was earmarked for environmental reviews and preliminary engineering for a Metro Rail extension program [16].
The expansion program aims to extend Metro Rail by 6.5 miles, reaching SUNY UB North Campus and beyond, just north of I-990. Ten new stations, including three on the North Campus, will help to connect high density job and residential centers [17]. With over 30,000 students and 14,000 employees [9], the three SUNY UB campuses are vital economic centers for the entire region. The newly extended line will allow students and employees to commute between campuses in under 20 minutes, one of the major reasons ridership is predicted to rise to around 45,000 commuters per day [18].
Not only does this $1.2 billion plan look to increase ridership, but it is again seen as an economic development tool and a way to lure in younger generations who are looking to live in more affordable cities where owning a car is optional [6]. With the majority of the new route being at grade, the hope is the stations will drive up commercial activity in the surrounding areas. The towns of Amherst and Tonawanda, which the proposed extension runs directly between along Niagara Falls Boulevard, support the plan with an eye towards investment along the corridor. Over $1.7 billion of investment is expected to follow, with an increase of $310 million in property value [18].

Source: New York State, Buffalo Billion
FTA Puts Up a Roadblock
Even with this positive outlook, the plan received a significant setback in early 2020. The Federal Transit Administration (FTA) left Metro Rail’s extension off of its New Starts program report, denying the project a grant for the Project Development phase. Without acceptance into the New Starts program, federal grant money will remain unavailable to NFTA, requiring the agency to reapply with an adjusted plan [19].
NFTA had been exploring alternative routes and construction methods, with an aim of reducing costs by around $200 million. Underground construction is to be reduced from around 10,000 feet to 3,900 feet, moving most of the construction for the project to street level. Keeping as much of the construction within the right-of-way, along with slight rerouting, will also help reduce the cost of construction along with reducing the amount of disruption residents and businesses will experience [18]. Without the acceptance into the 2020 New Start program, NFTA remains hopeful of gaining approval in the near future, although acquiring any Fully Funding Grant Agreement from the FTA before 2025 seems unlikely [19].
Although the project is experiencing a significant setback, it remains a promising prospect for the Buffalo region. In pushing for this expansion, NFTA looks to make good on its promise of Phase One from the original 1973 plan, finally connecting some of its most populous suburbs and largest employers with the city center. If what we ask of transit projects is to connect people with destinations and provide frequent service, Metro Rail in Buffalo is looking to do just that. With a fully realized Phase One, Metro Rail may be able to begin living up to the promises it made nearly five decades ago and begin to justify the extensive network that was once envisioned.
Sources
[1] Glaeser, Edward L. “Can Buffalo Ever Come Back?” City Journal, Autumn 2007. https://www.city-journal.org/html/can-buffalo-ever-come-back-13050.html
[2] Encyclopedia Britannica. “Buffalo, New York.” Accessed April 15, 2020. https://www.britannica.com/place/Buffalo-New-York
[3] Gargan, Edward A. “Buffalo Trolley Line Clangs to a Start.” The New York Times, October 10, 1984. https://www.nytimes.com/1984/10/10/nyregion/buffalo-trolley-line-clangs-to-a-start.html
[4] Bacheller, John. “The Decline of Manufacturing in New York and the Rust Belt.” Policy By Numbers. October 26, 2017. https://policybynumbers.com/the-decline-of-manufacturing-in-new-york-and-the-rust-belt
[5] World Population Review. “Buffalo, New York Population 2020.” Accessed May 1, 2020. https://worldpopulationreview.com/us-cities/buffalo-population/
[6] Byrnes, Mark. “A Struggling Metro System’s Big, Vague, Self-Destructive Idea.” City Lab, August 24, 2018. https://www.citylab.com/design/2018/08/a-struggling-metro-systems-big-vague-self-destructive-idea/567634/
[7] Forgotten Buffalo. “Transit Development Program.” Accessed March 10, 2020. http://www.forgottenbuffalo.com/forgottenbflofeatures/metrorail1973.html
[8] Knight, Kenneth G. “Buffalo's Light-Rail Rapid Transit System.” Niagara Frontier Transportation Authority. Accessed March 11, 2020. http://onlinepubs.trb.org/Onlinepubs/sr/sr182/182-007.pdf
[9] Horbovetz, Arian. “Buffalo’s Metro Rail: What Transit Should Be.” The Urban Phoenix, December 6, 2018. https://theurbanphoenix.com/2018/12/06/buffalohardworkingrail/
[10] Bliss, Laura. “A U.S. Transit Atlas That Ranks the Best (and Worst) Cities for Bus and Rail.” City Lab, November, 28, 2018. https://www.citylab.com/transportation/2018/11/best-transit-american-cities-bus-rail-subway-service/576739/
[11] Mapa-Metro. “Metro of Buffalo.” Accessed March 10, 2020. https://mapa-metro.com/en/united-states/buffalo/buffalo-metro-rail-map.htm
[12] Buffalo Rising. “The Next Phase of Cars Sharing Main Street Gets Underway.” August 27, 2018. https://www.buffalorising.com/2018/08/the-next-phase-of-cars-sharing-main-street-gets-underway/
[13] NFTA-Metro. 2017-2018 Annual Performance Report. Accessed May 3, 2020. https://metro.nfta.com/media/nclhoayl/annualperformancereport-18.pdf, p. 8
[14] Freemark, Yonah. “Have U.S. Light Rail Systems Been Worth the Investment?” City Lab, April 10, 2014. https://www.citylab.com/transportation/2014/04/have-us-light-rail-systems-been-worth-investment/8838/
[15] Smith, Sandy. “Buffalo Argues It Deserves Light Rail Funding — And Gets It.” Next City, April 3, 2019. https://nextcity.org/daily/entry/buffalo-argues-light-rail-funding
[16] New York State. “Buffalo Billion: Light Rail Extension Study.” Accessed March 10, 2020. https://buffalobillion.ny.gov/light-rail-extension-study
[17] WSP. “Planning Underway to Extend Buffalo Light Rail.” Accessed March 10, 2020. https://www.wsp.com/en-US/insights/extending-light-rail-in-buffalo
[18] McCarthy, Robert J. “NFTA Proposes New, Cheaper Route for Metro Rail Extension to Amherst. The Buffalo News, November 20, 2018. https://buffalonews.com/2018/11/20/nfta-proposes-new-cheaper-route-for-metro-rail-extension-to-amherst/
[19] Penner, Larry. “NFTA Denied FTA New Starts Qualification.” Railway Age, February 21, 2020. https://www.railwayage.com/passenger/light-rail/nfta-denied-fta-new-starts-qualification/


