• Blog
  • Blog Index
  • Video Work
  • About
Menu

Thomas Bardenett

Urban Planning - Writer - Filmmaker
  • Blog
  • Blog Index
  • Video Work
  • About
South Salina Street in Downtown Syracuse, NY

South Salina Street in Downtown Syracuse, NY

To Fight the Climate Crisis We Need: To Accept that Electric Cars Won’t Save Us

June 29, 2020

For the summer of 2020 I will be releasing a series of articles reflecting on some of the things cities, and urban planners specifically, can be advocating and planning for to help in our fight against the climate crisis. These pieces will reflect on our transportation networks, the need for urban living, and protecting our natural resources while bringing them into the city. While these are not comprehensive of everything that needs to be done to turn the tide of this crisis, they will provide a different vision of what our world could be like if we commit to a different form of development.


So much of the hopes of the environmentalist movement seems to rely on the large scale adoption of electric vehicles. Transportation currently accounts for 28 percent of the greenhouse gas emissions in the United States, more than any other sector of our economy, and we are currently the only major economy seeing that share increase. While electric vehicles are key to our transition away from fossil fuels, they are not a silver bullet.

First we must consider the amount of infrastructure that must be built in order to accommodate a full on switch to electric vehicles. Private vehicles will require different charging times and configurations than commercial vehicles or delivery trucks. Most personal vehicles will be able to be accommodated at your home or your place of business, but the larger vehicles may need more significant infrastructure to provide the charges necessary to propel their weight. This infrastructure is much easier to build out in urban and suburban areas where charging stations can be located within a decent range for these vehicles, but may become more difficult in long distance passages many tractor trailers use each day.

We must also consider how long it will take to switch everyone into an electric vehicle, let alone electric tractor trailers that can meet our current demands. When factoring in the average length of time cars stay on the road, it’ll be at least 15 years for our current American fleet to turn over. Ensuring that those vehicles are all electric would require a huge boost in production, taxes or regulations to push people towards purchasing electric vehicles, and a quick ramp up of the previously mentioned infrastructure needed to support this change. We must also consider the fact that the production of electric vehicles takes twice as much energy as our current internal combustion engine vehicles. While each of these facts will change as general energy production becomes cleaner, battery technology must also improve to solve some of the issues with current electric vehicles.

According to a report in The Verge, the batteries currently in use for electric vehicles remain difficult to recycle and too dangerous to dispose of in landfills, as “thermal runaway” may occur, resulting in possible explosions. Without a major ramping up of battery recycling programs, along with a redesign of batteries to make it simpler and safer to remove and replace them, electric vehicles will struggle to live up to their greener promises. We must also be concerned with non-exhaust related emissions, which are caused by the wear and tear of tires on asphalt. Replacing all vehicles with electric vehicles may even increase these forms of emissions, due to the heavier weights of the vehicles, which again requires the need to improve battery technology to lighten the load.

In his book Better Buses Better Cities, Steven Higashide references a study by the Air Resources Board in California that notes that even if every car in California switched to electric, and 75 percent of the energy grid used renewable sources, driving would still need to be decreased by over 15 percent to reach their current climate goals. A similar study was conducted in Hawaii, again finding that a switch to electric vehicles was not enough to fully remove their state’s dependence on fossil fuels. s part of this we must ensure that our transit agencies move towards all electric fleets, something that Edmonton, Canada is working towards on a large scale. Their new electric fleet was designed specifically with efficiency in mind, both in terms of charging efficiency and financial efficiency (charging stations with fewer moving parts require agencies to have fewer replacements on hand, and less risk of things going wrong.) Edmonton’s transit agency understood the need for the transition and wanted to ensure that these large scale investments were made in a responsible way. While it's difficult to require private citizens and corporations to move to all electric, requiring publicly supported agencies to make the move is far easier and helps push our urban infrastructure in the direction of an electric future.

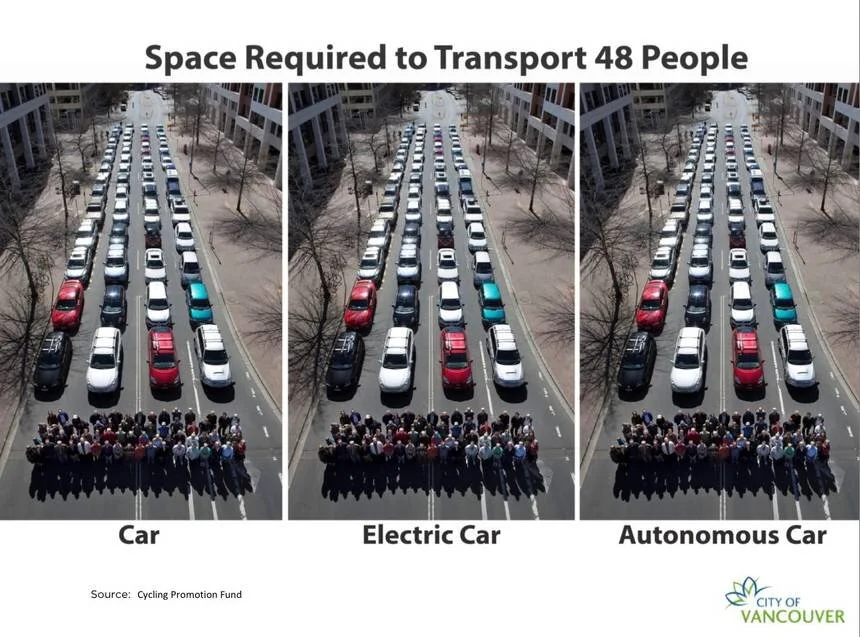
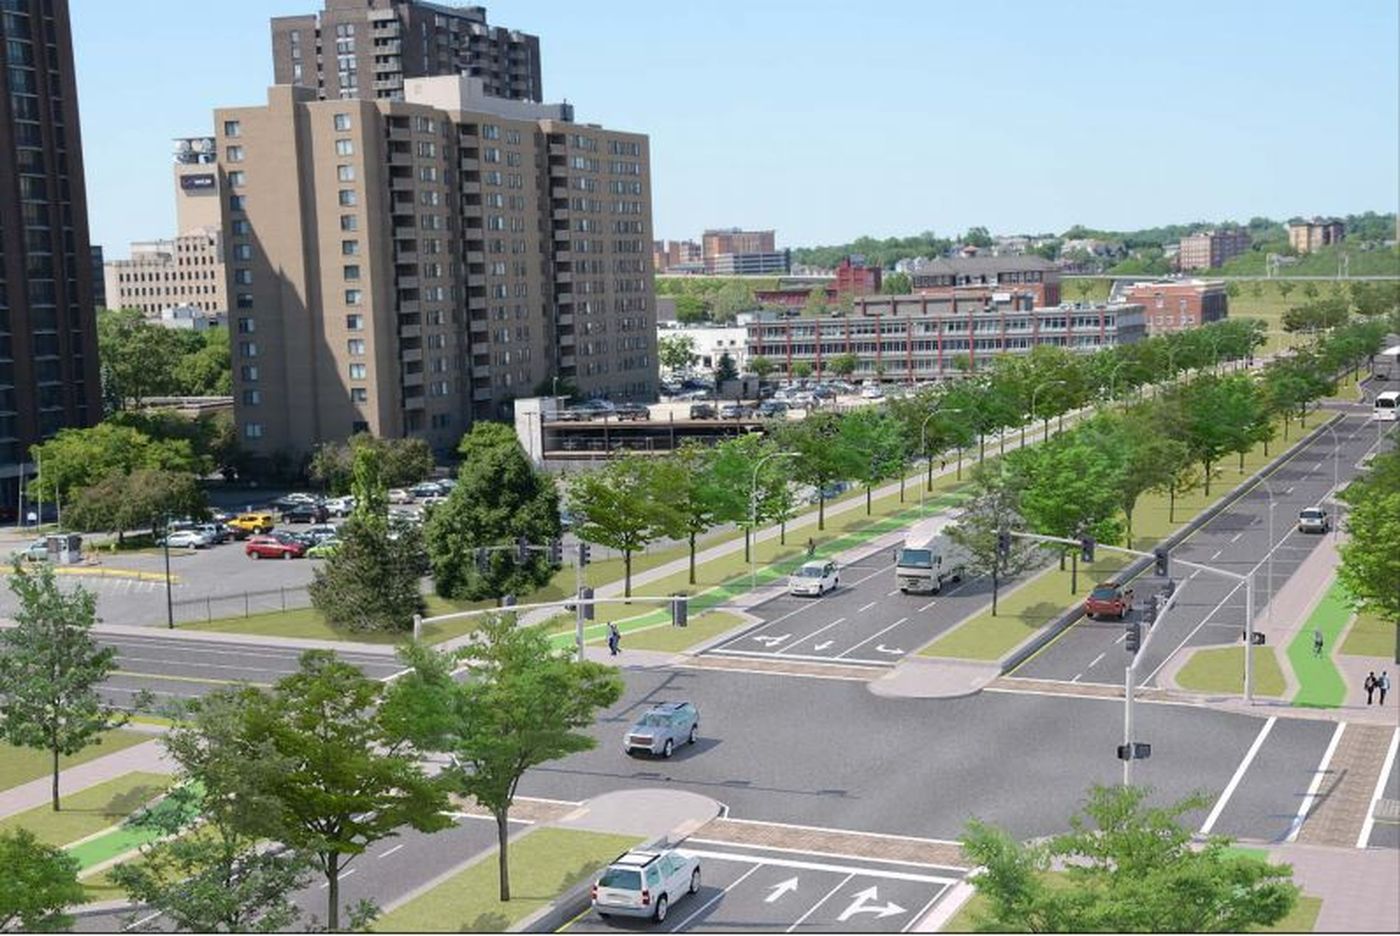
Beyond the technological challenges that must be addressed, we must also consider whether the space we currently devote to personal vehicles is healthy for cities and communities moving forward. In the image below, which has made the rounds on the internet, we start to understand that no matter what technology we develop, cars will still take up way more space to move the same amount of people than public transit or cycling infrastructure. Many will argue that autonomous vehicles will “solve congestion” but most of these scenarios assume that pedestrians won’t be around, or they’ll be penned in like animals. Anyone who envisions that as an ideal city must never have spent time in a city. People on foot are the life of cities, and everyone is a pedestrian at some point in their travels. 

Car Space on Roads.jpeg

On the other hand, you can look to Helsinki, Finland and the recognition that we must prioritize efficiency and accessibility within cities. On their hierarchy for infrastructure investment they rank personal vehicles last in terms of importance, with an understanding that urban spaces must prioritize residents over commuters. Not only does this help create spaces for communities and neighbors, which are increasingly needed, but it also demonstrates that we have the ability to make significant progress in our climate goals without waiting for technology to improve. But even in the more liberal areas of this country, advocating against the interests of drivers faces stiff opposition. The War on Cars podcast spent an episode reflecting on this blind spot in liberal policy making, but we can also see this reflected in some of the bigger climate proposals of the last few years, who rarely, if ever, question the dominance of the personal vehicle.*

All of this is not to say we don’t need electric vehicles, and in fact we need them quickly. Requiring all new vehicles to be electric would do a great deal of good in our fight against the climate crisis, but we must also work to disincentivize driving and promote other forms of travel, including both public transit and active transit options. As we’ve seen, the space given over to private vehicles must be corrected to provide space for greener, healthier forms of transportation while reducing the amount of vehicles being produced each year, helping further curb our energy needs.

*This piece has focused on the environmental impacts of electric vehicles, but there are general safety concerns that should be considered for personal vehicles, especially with the newer obsession with SUVs and trucks, which also abide by lower emissions standards than sedans due to their classification.

In Urban Planning, Transportation, Climate Crisis Tags Climate Crisis
Comment
Source: NFTA Metro

Source: NFTA Metro

The Buffalo Metro: Finishing Phase One

May 21, 2020

Cities across the country have poured money into expanding light rail systems for several decades, with few achieving the success they had promised. While there are many reasons for the success or failure of each individual project, one of the most prominent reasons is the lack of connectivity between where people live and where people work. One system that has achieved this balance, on a small scale, is the Niagara-Frontier Transportation Authority’s (NFTA) Metro Rail, located in Buffalo, New York. With just over six miles of track, the system has a per mile ridership on par with many more transit rich cities throughout the country, and is advancing an expansion proposal that will further connect vital economic centers, finally completing what was once known as Phase One for metro. Buffalo’s metro expansion offers up an example of light rail transit that can both drive ridership and development along the corridor, something the city of Buffalo has recognized it needed for decades.

The Queen City

Buffalo’s long economic downturn obscures the immense prosperity that the region experienced for the first half of the Twentieth Century. Located at the western terminus of the Erie Canal, and on the eastern shore of Lake Erie, Buffalo was a central shipping hub connecting the East Coast with the Midwest. Millions of bushels of grain passed through the city’s ports every year, leading to the development of large grain mills along the shore. By the beginning of the Twentieth Century, Buffalo surpassed Minneapolis in terms of its grain output [1]. Ship building, steel and iron production, and meat packing plants quickly grew along with the city, which was one of the ten largest cities in the country at the turn of the century [2]. Buffalo would reach its peak population of over 580,000 residents in 1950 [1], the same year the last of the city’s original streetcars would end operations [3]. 

A shift away from shipping and towards the use of trucks and trains to move freight removed the geographic advantage the city enjoyed for over a hundred years [1]. In 1970, manufacturing accounted for over 35 percent of employment in the metropolitan region. By 2014 that share had dropped to around 10 percent, as manufacturing moved towards the south or internationally to find cheaper labor [4]. As the labor market changed, the demographics of the city changed with it. Since 1950, the population of the city has plummeted, losing over 100,000 people in the 1970s alone [1]. As of 2018, the population of Buffalo has stabilized around 256,000 residents, less than half of its peak population [5]. During this time of decline, the city began exploring ways to reinvigorate its urban core and connect its rapidly growing suburbs to downtown. By the late 1960s, a plan for a regional rail network had emerged as a desirable method of  drawing investment back into the city.

The Original Metro Plan

Source: Forgotten Buffalo, “Metro Report: Niagara Frontier’s 1995 Transit System”

Source: Forgotten Buffalo, “Metro Report: Niagara Frontier’s 1995 Transit System”

Governor Nelson Rockefeller [R] was an early supporter of the plan to bring rail transit back to the city of Buffalo, with an eye towards connecting the newly constructed SUNY University of Buffalo (UB) campus in Amherst with the downtown core [6]. A combination of federal and state funding was awarded to begin studying the proposed corridor, two-thirds of which came from the Urban Mass Transit Administration (UMTA). As planning evolved, NFTA was created in 1967 in order to bring all modes of public transportation in the Buffalo metro area under one roof, including the Port of Buffalo and the two international airports in the region [7]. By 1973, a proposal for an extensive regional heavy rail network was unveiled, titled “Metro Report: Niagara Frontier’s 1995 Transit System,” [7] laying the groundwork for the only major investment in rail transit in New York state outside of the New York metropolitan area.

Over the course of multiple phases the planned network would reach a total length of 46 miles, connecting Buffalo with its largest suburbs along with a line directly to Niagara Falls, New York. The first phase, known as the Blue Line, would run from Downtown Buffalo northeast to the SUNY UB North Campus in Amherst, the most populous suburb of Buffalo, almost entirely along the Main Street corridor, for a total of 12 miles. The route required the removal of 99 families, 78 businesses, and the acquisition of 130 structures, with plans to run service as frequently as every two minutes during peak periods with connections to bus routes at every station [7]. Phase Two would include a new line that headed directly north out of the city into the town of Tonawanda toward Niagara Falls, along with an extension of the Blue Line to the north and south. Future phases would look to expand into the metropolitan region including the Cheektowaga Corridor heading east, the Hamburg Corridor heading south, and the Richmond Corridor to the northwest [7].

A Need to Scale Back

As soon as the regional plan was published, hope for the ambitious network to be completed began to fade. Governor Rockefeller would leave the governor’s mansion to become the Vice President of the United States, removing the plan’s strongest ally in the state government. At the same time, the town of Amherst pulled support from the plan, citing concerns over mass transit bringing “urban ills” to their community, a devastating blow as one of the network’s major destinations, SUNY UB North Campus, is located within its borders [6]. 

Federal funding is key to the success of any transit plan of this scale succeeding, which proved to be the final blow to the initial ambitions of this network. Concerns over Buffalo’s shrinking size and economic downturn, coupled with the federal government’s new found reluctance to invest in public transit projects resulted in the project scaling back considerably [3]. Phase One was scaled back from a 12 mile route to just under 6.5 miles, ending at the city’s border at SUNY UB’s South Campus. Another major alteration was the switch from heavy rail to light rail, significantly reducing the cost of infrastructure along the route [6]. Even with this switch, the plan still called for amenities similar to heavy rail systems, such as raised platform boarding and prepaid fares. With these changes, UMTA agreed to fund the project in 1976 at an estimated cost of $336 million [8], eventually growing to $530 million ($1.24 billion today) [6].

Source: Knight, Kenneth G. “Buffalo’s Light-Rail Rapid Transit System”

Source: Knight, Kenneth G. “Buffalo’s Light-Rail Rapid Transit System”

Construction began in 1979 with the downtown street level tracks opening to the public in 1984. This 1.2 mile stretch would operate as a transit mall and provide free service to those using the system at the six stations within this zone. The final 5.2 miles of track, all underground, would not be opened to the public until 1986, bringing the total length of the line to 6.4 miles [6]. Upon its grand opening, Rep. Henry J. LaFalce [D], of Tonawanda, believed the new system would only succeed if two extensions were added to the route [3]. Those extensions never came, and as a result this network remains one of the shortest lines in the country.

Current State of the Metro

Source: Mapa-Metro

Source: Mapa-Metro

Even with its shortened line, Buffalo’s metro has enjoyed healthy ridership throughout its existence, although it has experienced a gradual decline in ridership overall. In the early 1990s Metro Rail’s share of all transit usage in the region was around 25% [9], with ridership peaking in 1991 at 8.5 million annual riders [6]. Today Metro Rail accounts for around 17% of total ridership, with around 4.5 million annual riders. Even with this decline, the system functions with a higher per mile ridership than most light rail networks throughout the country, with just under 2,500 riders per mile, even when compared to cities many would deem transit rich, such as Portland [10]. 

Many factors contribute to the continued success of the network, including its connectivity and fare pricing, while the service hours may be a hindrance. Unlike many of the recent investments in light rail and streetcar systems, Buffalo’s Metro Rail successfully connects residential neighborhoods with some of the larger economic centers in the region, including Downtown Buffalo and two of the SUNY UB campuses, South and the medical campus. Within a 15 minute walk, riders are also able to reach many cultural destinations, such as the Buffalo Zoo, Delaware Park, and the Elmwood neighborhood, which is known for its local culture [9]. A flat fare system also benefits riders, with both buses and Metro Rail costing $2 per ride, with all day and monthly passes available, keeping it easy and affordable for most riders using the system. One thing that may be holding back some ridership numbers is service ending at 1am, even on the weekends. With bars and restaurants being open until 4am, an early service end may be preventing some from considering Metro Rail as a transit option on their night out [11].

While ridership is comparatively high, the original intent of the network, to boost economic development in the urban core, is only now starting to see some success. For over 40 years, Main Street through Buffalo has been emptying out, leaving vacant storefronts and buildings along the corridor. Over the last several years, Buffalo has followed the national trend of seeing reinvestment in central cities, with a large portion of the local investment coming from SUNY UB and its medical campus [6]. Due to the line’s central positioning, NFTA has seen this as an opportunity to capitalize on the reinvestment, looking for private partners to revamp some of its older, dated stations [6]. 

Not all of the new developments in Buffalo have been positive for Metro Rail. Over the last few years, the city has been reintroducing cars to Main Street, with a plan to completely revamp the downtown portion of the corridor in the next several years. The mayor of the city has touted this reintroduction of cars as an economic boon for the community, and believes it is a major reason for the reinvestment that has been occurring there [12]. This claim is tough to prove, when considering the overall momentum cities have experienced over that same period of time, but its effects on Metro Rail can be seen with falling on time performance [13]. This decreasing reliability impacts the mode choice of residents, while continuing to promote the use of cars over transit. Yonah Freemark writes in City Lab that, “Increases in transit use are only possible when the low costs of driving and parking are addressed, and when government and private partners work together to develop more densely near transit stations.” [14] This current action by the city, with support from Senator Schumer, has done the exact opposite in terms of promoting the use of transit within our central cities. At the same time, NFTA has been working to develop a plan for expanding Metro Rail into the suburbs to finally connect to SUNY UB North Campus, with full support from Governor Andrew Cuomo [D]. 

Expansion Plans

Source: NFTA Metro

Source: NFTA Metro

New York State’s transportation funding formula does not take into account Buffalo’s unique position as the only community in Upstate New York to have rapid rail transit, leaving the system’s state funding on par with cities that only operate buses [15]. As a result, NFTA has been arguing in favor of expanded funding, pointing out that the proper maintenance of Metro Rail is vital in terms of gaining access to federal funding for capital programs in the region. As a response, the state awarded NFTA a $100 million grant to fund needed repairs and upgrades throughout the system including trackbed replacement, implementation of a new fare collection system, vehicle upgrades, and a new video surveillance system [16]. In 2017, Governor Cuomo announced Phase Two of the Buffalo Billion program, with $215 million going towards revitalization and smart growth programs. Around $5 million of that new funding was earmarked for environmental reviews and preliminary engineering for a Metro Rail extension program [16]. 

The expansion program aims to extend Metro Rail by 6.5 miles, reaching SUNY UB North Campus and beyond, just north of I-990. Ten new stations, including three on the North Campus, will help to connect high density job and residential centers [17]. With over 30,000 students and 14,000 employees [9], the three SUNY UB campuses are vital economic centers for the entire region. The newly extended line will allow students and employees to commute between campuses in under 20 minutes, one of the major reasons ridership is predicted to rise to around 45,000 commuters per day [18].

Not only does this $1.2 billion plan look to increase ridership, but it is again seen as an economic development tool and a way to lure in younger generations who are looking to live in more affordable cities where owning a car is optional [6]. With the majority of the new route being at grade, the hope is the stations will drive up commercial activity in the surrounding areas. The towns of Amherst and Tonawanda, which the proposed extension runs directly between along Niagara Falls Boulevard, support the plan with an eye towards investment along the corridor. Over $1.7 billion of investment is expected to follow, with an increase of $310 million in property value [18].

Source: New York State, Buffalo Billion

Source: New York State, Buffalo Billion

FTA Puts Up a Roadblock

Even with this positive outlook, the plan received a significant setback in early 2020. The Federal Transit Administration (FTA) left Metro Rail’s extension off of its New Starts program report, denying the project a grant for the Project Development phase. Without acceptance into the New Starts program, federal grant money will remain unavailable to NFTA, requiring the agency to reapply with an adjusted plan [19].

NFTA had been exploring alternative routes and construction methods, with an aim of reducing costs by around $200 million. Underground construction is to be reduced from around 10,000 feet to 3,900 feet, moving most of the construction for the project to street level. Keeping as much of the construction within the right-of-way, along with slight rerouting, will also help reduce the cost of construction along with reducing the amount of disruption residents and businesses will experience [18]. Without the acceptance into the 2020 New Start program, NFTA remains hopeful of gaining approval in the near future, although acquiring any Fully Funding Grant Agreement from the FTA before 2025 seems unlikely [19].

Although the project is experiencing a significant setback, it remains a promising prospect for the Buffalo region. In pushing for this expansion, NFTA looks to make good on its promise of Phase One from the original 1973 plan, finally connecting some of its most populous suburbs and largest employers with the city center. If what we ask of transit projects is to connect people with destinations and provide frequent service, Metro Rail in Buffalo is looking to do just that. With a fully realized Phase One, Metro Rail may be able to begin living up to the promises it made nearly five decades ago and begin to justify the extensive network that was once envisioned.


Sources

[1] Glaeser, Edward L. “Can Buffalo Ever Come Back?” City Journal, Autumn 2007. https://www.city-journal.org/html/can-buffalo-ever-come-back-13050.html

[2] Encyclopedia Britannica. “Buffalo, New York.” Accessed April 15, 2020. https://www.britannica.com/place/Buffalo-New-York

[3] Gargan, Edward A. “Buffalo Trolley Line Clangs to a Start.” The New York Times, October 10, 1984. https://www.nytimes.com/1984/10/10/nyregion/buffalo-trolley-line-clangs-to-a-start.html

[4] Bacheller, John. “The Decline of Manufacturing in New York and the Rust Belt.” Policy By Numbers. October 26, 2017. https://policybynumbers.com/the-decline-of-manufacturing-in-new-york-and-the-rust-belt

[5] World Population Review. “Buffalo, New York Population 2020.” Accessed May 1, 2020. https://worldpopulationreview.com/us-cities/buffalo-population/

[6] Byrnes, Mark. “A Struggling Metro System’s Big, Vague, Self-Destructive Idea.” City Lab, August 24, 2018. https://www.citylab.com/design/2018/08/a-struggling-metro-systems-big-vague-self-destructive-idea/567634/

[7] Forgotten Buffalo. “Transit Development Program.” Accessed March 10, 2020. http://www.forgottenbuffalo.com/forgottenbflofeatures/metrorail1973.html

[8] Knight, Kenneth G. “Buffalo's Light-Rail Rapid Transit System.” Niagara Frontier Transportation Authority. Accessed March 11, 2020. http://onlinepubs.trb.org/Onlinepubs/sr/sr182/182-007.pdf

[9] Horbovetz, Arian. “Buffalo’s Metro Rail: What Transit Should Be.” The Urban Phoenix, December 6, 2018. https://theurbanphoenix.com/2018/12/06/buffalohardworkingrail/

[10] Bliss, Laura. “A U.S. Transit Atlas That Ranks the Best (and Worst) Cities for Bus and Rail.” City Lab, November, 28, 2018. https://www.citylab.com/transportation/2018/11/best-transit-american-cities-bus-rail-subway-service/576739/

[11] Mapa-Metro. “Metro of Buffalo.” Accessed March 10, 2020. https://mapa-metro.com/en/united-states/buffalo/buffalo-metro-rail-map.htm

[12] Buffalo Rising. “The Next Phase of Cars Sharing Main Street Gets Underway.” August 27, 2018. https://www.buffalorising.com/2018/08/the-next-phase-of-cars-sharing-main-street-gets-underway/

[13] NFTA-Metro. 2017-2018 Annual Performance Report. Accessed May 3, 2020. https://metro.nfta.com/media/nclhoayl/annualperformancereport-18.pdf, p. 8

[14] Freemark, Yonah. “Have U.S. Light Rail Systems Been Worth the Investment?” City Lab, April 10, 2014. https://www.citylab.com/transportation/2014/04/have-us-light-rail-systems-been-worth-investment/8838/

[15] Smith, Sandy. “Buffalo Argues It Deserves Light Rail Funding — And Gets It.” Next City, April 3, 2019. https://nextcity.org/daily/entry/buffalo-argues-light-rail-funding

[16] New York State. “Buffalo Billion: Light Rail Extension Study.” Accessed March 10, 2020. https://buffalobillion.ny.gov/light-rail-extension-study

[17] WSP. “Planning Underway to Extend Buffalo Light Rail.” Accessed March 10, 2020. https://www.wsp.com/en-US/insights/extending-light-rail-in-buffalo

[18] McCarthy, Robert J. “NFTA Proposes New, Cheaper Route for Metro Rail Extension to Amherst. The Buffalo News, November 20, 2018. https://buffalonews.com/2018/11/20/nfta-proposes-new-cheaper-route-for-metro-rail-extension-to-amherst/

[19] Penner, Larry. “NFTA Denied FTA New Starts Qualification.” Railway Age, February 21, 2020. https://www.railwayage.com/passenger/light-rail/nfta-denied-fta-new-starts-qualification/

In Transportation, Urban Planning, Buffalo
1 Comment

Little Neck Bay in Northeastern Queens, NY

Bike Lanes in Northeastern Queens

February 24, 2020

Over the course of four months, as part of an eight member team, I helped produce an in depth look at how bike lanes and pedestrian improvements could benefit a corner of New York City that is often overlooked when it comes to transportation projects. Tucked away at the far eastern border where Queens meets Nassau County, Community District 11 (Auburndale, Bayside, Douglaston, Douglas Manor, East Flushing, Hollis Hills, Little Neck, and Oakland Gardens) often shares much more in common with smaller cities across the country than with the rest of New York City. Nearly every family has access to at least one car, and those who travel by public transit are primarily using the bus. Beautiful parks and green spaces populate the area, and most homes have small backyards for kids to play in. These are scenes you don’t associate with the largest city in the country, yet here it is.

Our eight member team, assembled as part of the Planning Studio requirement for attaining a Masters in Urban Planning from CUNY Hunter College, took on the task of bridging the gap between the community and NYC DOT with hopes of bringing needed improvements to the area’s transportation network. While I don’t wish to get into the details of the plan (which you can read at the link below), I look to briefly reflect on what was learned through this process.

Improving Livability in Northeastern Queens: A Vision for Complete Streets

A protected bike lane along Northern Boulevard. The implementation of this needed infrastructure caused a rift between the community and NYC DOT.

There Is Space for EvERYONE

American cities have continually overbuilt our roadways, especially on the local level. While this has become a common place notion among planners over the course of a few decades, we still have not fully grappled with how to repurpose this space and do so without making communities feel as though they are losing something. This doesn’t mean that a bike lane should be placed on every street with excess space. It doesn’t even mean that we always need a bike lane to begin with.

During our outreach to the public and our in person observations, we came to realize that many streets within the neighborhood are already safe for riding bikes, even without infrastructure there. This is the case for countless neighborhood streets across the country where only residents drive and usually at very slow speeds as they approach their homes. These are the streets millions of kids learn how to ride their bikes for the first time. By acknowledging this to the community we also gained their trust that we weren’t going to be putting infrastructure where it wasn’t needed. We made clear that only wanted to intervene where it was important to improve safety or help direct riders.

Old in Body, Young at Heart

We were continually surprised at the number of people over 65 who ride bikes everyday, including an 86 year old man who rides his bike everyday. It was a good reminder that all spaces should be accessible to all ages. While I continually find myself considering how children interact with spaces, primarily due to my background of working in schools, those same considerations should be shown for our aging neighbors. Just because they are getting older does not mean they don’t plan on staying active within their neighborhood. Positioning bike infrastructure and pedestrian improvements as a way to encourage a more active lifestyle and improve safety can be one way to encourage a conversation about how we interact with our environment.

Stay Involved

One of the most important decisions our team made was to stay in active contact with the local transportation committee. While our client may have been the DOT, we knew that we needed to be even more involved with the community. By showing up to meetings, reaching out for conversations, and staying in touch, we were able to bring our plan to the community and have a real discussion about our report. They may not have agreed with everything in our final report, but they found many proposals that they were interested in pursuing. We continually emphasized that the purpose of our plan was to start a conversation, and now the community and DOT have a common point of reference to work from.

While we always wish that we could’ve contacted more residents and gained even more insight into the needs of the community, we believe our commitment to involving the committee members throughout helped shape our plan in a tangible way. And while I cannot speak for every member of our team, I do believe that many of us would be happy to continue fielding questions about the plan proposals and findings to help the community move forward.

In Transportation, Urban Planning
Comment
Buffalo, NY Metro

Buffalo, NY Metro

Public Transportation Needs More Than a Rail to Run On

June 1, 2019

Public transportation, specifically rail transportation, has been a hot topic lately. The Green New Deal resolution puts rail as a top priority when it comes to transforming our transportation systems (Ocasio-Cortez, 2019, p. 8-9). Numerous cities have voted on whether to increase taxes to support the expansion of rail transit (McDonald, 2018, para. 7). And New York, a city with more rail transit than any other in the United States, is considering adding its first streetcar in decades (Newman, 2018).

Each of these efforts are due to a desire to increase public transit ridership, reduce congestion, and lower greenhouse gas emissions to help combat climate change. While there is plenty of evidence to back-up the efficiency of rail transit over other forms of land transportation (Hoffrichter, 2019, para. 8), there has been less research performed on whether rail transit boosts public transportation ridership. This push for rail transit is admirable, but it is crucial that we understand if these investments lead to higher rates of transit usage. To fill this information gap, I performed a statistical analysis reflecting prior research in order to gauge rail transit’s effect on transit ridership in cities.

Variety in Demographics and Physical Environments

Previous research has focused on what demographic groups ride public transportation. Overall the research has shown that transit riders are more likely to be a lower income person of color. While less than 40 percent of the U.S. population identifies as a minority race, 60 percent of public transit riders do (American Public Transportation Association, 2017, p. 4). Median incomes for riders are $4,314 lower than median incomes for those who commute alone by car (Maciag, 2014, para. 2-5). While cities can promote diversity and inclusion, every city hopes to boost incomes instead of lowering them.

Research has also shown that individuals with a Bachelor’s Degree or higher tend to take rail transit over  other forms of public transit; 70 percent of rail transit riders versus 51 percent on all forms of transit (American Public Transportation Association, 2017, p. 38-40). This dichotomy of riders, both highly educated and lower median incomes, suggests that transit is serving a diverse set of constituents across a diverse landscape.

There has also been discussion about what types of transportation work best in different physical settings. Often density is considered a key aspect in promoting public transportation, and low density has been cited by cities to justify investing in highways instead of public transit networks (Public Transport Users Association, 2019, para. 19). Others argue that there is a difference between density and walkability, stating that most residents live within easy walking distance to public transit (James, 2018, para. 6). While living nearby, their physical environment may be built in such a way that discourage them from using transit, perhaps a poor layout of the street network, or inclusion of cul-de-sacs (Stromberg, 2015, para. 8-11).

View fullsize 2018-09-28 08.33.38 2.jpg
View fullsize 2018-09-28 08.33.40 1.jpg

Finding Rail’s Place In The Equation

Each of these characteristics influence the viability of public transportation. In order to determine how rail transit factors into public transportation, data from the 2017 American Community Survey 5-Year Estimates was collected for 100 cities. The cities range in size from Salt Lake City (pop. 194, 188) to San Francisco (pop. 864,263), avoiding smaller cities and large cities, such as New York and Chicago, who might skew results too far one way or the other. The census data was combined with Walk Scores (which serves as a proxy for the built environment) and the political party of the governor for each state (reflecting funding priorities based on ideology).

When tested on its own, cities with rail transit systems resulted in public transit ridership being over 7 percentage points higher than in cities without rail transit. This was a significant boost to the idea that rail transit is a worthwhile investment, but does not produce a full picture. To showcase the differences in the models, Rochester, NY is used as an example in the graph below, as it currently does not have access to rail transit.

Once we take into consideration demographic differences between cities, the presence of rail transit sees a slightly lower effect, with public transit ridership being over 4 percentage points higher in cities with rail over cities without. Still a significant boost in ridership that would seem to justify the expense of building out a rail system, but the results become more clouded when the physical environment of a city comes into play.

Accounting for walkability and density, rail transit becomes insignificant in terms of increasing public transit ridership. When cities are more walkable people are able to get most of what they need within walking distance, removing the need for a car. For trips outside of their neighborhood, they then must rely on public transportation, regardless of which form it is.

There are some limitations to the analysis performed, with the major issue being funding. While political parties view public transit differently and will prioritize it according to those views, it does not fully account for the differences in funding for each of these systems.

There is also the simple fact that some transit networks are better planned than others. While a transit system may have ample funding, if the network is not designed properly it will not be able to increase ridership.  Rochester is an example of a city that is underperforming due to the design and implementation of its system.

Screen Shot 2019-05-26 at 1.54.11 PM.png

Recommendations

With the environmental crisis of climate change looming, we must continue to advocate for policies that promote public transportation and a more efficient city. While the data is not conclusive when it comes to the benefits of rail transit, it does point to some important steps cities can take.

Promote Dense, Walkable Neighborhoods

Through zoning and other comprehensive planning techniques, cities can emphasize dense, walkable development. This does not mean every city needs to be as dense as New York City or Chicago. This means producing neighborhoods where most errands can be done on foot. Reducing the need to venture outside of one’s own neighborhood also reduces the need for a car. Public transit will be used to connect these walkable neighborhoods, allowing residents and visitors to feel comfortable getting around without a car.

Plan Within Your Budget

Not every city can afford to build rail transit. Not every city can afford to build out a bus rapid transit (BRT) network. Cities must consider plans that provide the greatest service within their own budget. Houston opted to revamp their bus network into a grid like structure, understanding that not all commutes end in the downtown area anymore. This restructuring resulted in a noticeable increase in transit ridership without having to invest in a physical infrastructure (Bliss, 2018, para. 4 and 10).

Ensure Affordable Housing Around Transit

Lower-income residents and minority populations rely on public transportation to a greater degree than their higher-income and white neighbors. Ensuring that any development along transit lines includes a large portion of affordable housing will provide increased accessibility for those who need it the most. Protecting residents against gentrification is paramount to growing transit ridership and improving accessibility for those who need it most.

Troy, NY

Troy, NY

To read the formal statistical analysis feel free to contact me at: tom@thomasbardenett.com


Sources/ References

  • American Public Transportation Association (2017, January). Who Rides Public Transportation. Retrieved from https://www.apta.com/resources/reportsandpublications/Documents/APTA-Who-Rides-Public-Transportation-2017.pdf

  • Bliss, Laura (2018, November 28). A U.S. Transit Atlas that Ranks the Best (and Worst) Cities for Bus and Rail. Retrieved from https://www.citylab.com/transportation/2018/11/best-transit-american-cities-bus-rail-subway-service/576739/

  • Governing (2019). Land Area for U.S. Cities Map. Retrieved from https://www.governing.com/gov-data/census/Land-Area-for-US-Cities.html

  • Hoffrichter, Andreas (2019, April 1). Why Trains Are So Much Greener Than Cars and Airplanes. Retrieved from https://www.citylab.com/transportation/2019/04/rail-transportation-carbon-emissions-green-new-deal/586240/

  • James, Owain (2018, July 3). Every City can be a Transit City, Regardless of Density. Retrieved from https://mobilitylab.org/2018/07/03/your-city-doesnt-need-to-be-new-york-to-have-great-transit/

  • Maciag, Mike (2014, February 25). Public Transportation’s Demographic Divide. Retrieved from https://www.governing.com/topics/transportation-infrastructure/gov-public-transportation-riders-demographic-divide-for-cities.html

  • McDonald, Dr. Mark (2018, May 8) Postmortem Analysis of the Let’s Move Nashville Plan’s Train Wreck. Retrieved from http://tennesseestar.com/2018/05/08/dr-mark-mcdonald-postmortem-analysis-of-the-lets-move-nashville-plans-train-wreck/

  • National Governors Association (2019). Current Governors. Retrieved from https://www.nga.org/governors/

  • Newman, Andy (2018, Aug. 30) New Plan for City Streetcar: Shorter, Pricier, and Not Coming Soon. Retrieved from https://www.nytimes.com/2018/08/30/nyregion/nyc-streetcar-brooklyn-queens.html

  • Nirappil, Fenit (2019, January 2). D.C. Mayor Bowser takes the oath of office for a second term. Retrieved from https://www.washingtonpost.com/local/dc-politics/dc-mayor-bowser-to-take-the-oath-of-office-for-a-second-term/2019/01/02/6ada0404-0de2-11e9-84fc-d58c33d6c8c7_story.html?utm_term=.0f3091fdc46e

  • Ocasio-Cortez, Alexandria (2019, Feb. 5) Resolution Recognizing the Duty of the Federal Government to Create a Green New Deal. Retrieved from https://www.vox.com/2019/2/7/18215290/alexandria-ocasio-cortez-ed-markey-green-new-deal

  • Public Transport Users Association (2019, January 31). Myth: Viable Public Transport Require High Population Densities. Retrieved from https://www.ptua.org.au/myths/density/

  • Schwandl, Robert (n.d.). Urban Rail. Retrieved from http://www.urbanrail.net/am/america.htm

  • Stromberg, Joseph (2015, August 10). The Real Reason American Public Transportation is Such a Disaster. Retrieved from https://www.vox.com/2015/8/10/9118199/public-transportation-subway-buses

  • U.S. Census Bureau (2017) Demographic and Housing Estimates, 2013-2017 American Community Survey, 5-year estimates. Retrieved from https://factfinder.census.gov/faces/tableservices/jsf/pages/productview.xhtml?pid=ACS_17_5YR_DP05&prodType=table

  • U.S. Census Bureau (2017) Educational Attainment, 2013-2017 American Community Survey, 5-year estimates. Retrieved from https://factfinder.census.gov/faces/tableservices/jsf/pages/productview.xhtml?pid=ACS_17_5YR_S1501&prodType=table

  • U.S. Census Bureau (2017) Means of Transportation to Work by Selected Characteristics, 2013-2017 American Community Survey, 5-year estimates. Retrieved from https://factfinder.census.gov/faces/tableservices/jsf/pages/productview.xhtml?pid=ACS_17_5YR_S0802&prodType=table

  • U.S. Census Bureau (2017) Selected Economic Characteristics, 2013-2017 American Community Survey, 5-year estimates. Retrieved from https://factfinder.census.gov/faces/tableservices/jsf/pages/productview.xhtml?pid=ACS_17_5YR_DP03&prodType=table

  • Walk Score (2019). Walk Score Methodology. Retrieved from https://www.walkscore.com/methodology.shtml

In Urban Planning, Transportation
Comment
Source: NPR

Source: NPR

I-81: Healing the Divide

May 10, 2019

This is my in depth look into why the community grid should be approved by New York State to replace the current I-81 viaduct. The following piece was written before the Draft Environmental Impact Statement (DEIS) was released in mid-April 2019 in regards to the I-81 project. Although some of the numbers from the previously leaked report are now out of date, they remain useful for the analysis and would still hold true with the new numbers.

I hope this helps to inform the discussion as we now move forward into the comment period for the DEIS. Although the community grid is the preferred option, that does not mean it will be selected in the end. It also means that we must advocate for further inclusions to the plan, which I lay out a few at the end. As always, I love to hear what people are thinking on these subjects and invite a discussion.


The Syracuse metropolitan area has some of the highest concentrations of poverty in the United States for African Americans and Hispanics, along with dramatic racial and economic divides between the city and its surrounding suburbs. The current footprint of I-81 has furthered this divide within the community. The decision on how to replace the aging viaduct must be made with economic and social equality in mind. To address these issues, the following memo will provide: a brief summary of the socioeconomic breakdown of the Syracuse region; an understanding of the impacts I-81 has had on furthering the socioeconomic divide within the community; and, a review of the current options for replacing the I-81 viaduct (a new viaduct, a community grid, or a tunnel), including the concerns raised by the community for each option.

Based on the analysis, I recommend the New York State Department of Transportation opts to pursue the Community Grid option with added emphasis on:

  • Enhancing public transportation with bus rapid transit (BRT)

  • Returning newly uncovered lands to the city

    • Some to be sold for private development

    • Some developed into low- and medium-income housing

  • Connecting residents of public housing with work opportunities on the project

Background on the Syracuse Metropolitan Area

Syracuse is the fifth largest city in New York State with a population of 144,405 and sits within a metropolitan statistical area (MSA) of 659,262 (U.S. Census Bureau). Our MSA consists of three counties; Madison, Onondaga, and Oswego. In order to gain a fuller picture of the region you must also include Cayuga, Cortland and Oneida counties as they’re economies are tied closely to that of Syracuse, which pushes the region’s population to 1,018,239 (U.S. Census Bureau).

We must look at the counties outside of Onondaga County due to the commutes required into the Syracuse area. Each county has a relative high percentage of residents working outside their home county, with the main employment destination being near Downtown Syracuse (see employment maps below). With residents being primarily dependent on personal vehicles, the interstate network in the region is vital to their transportation needs (see Public Transit Usage in Table 1). Those traveling from east or west will be most likely to utilize I-90 and I-690 in order to access the downtown area. Oswego County, coming from the north, will utilize I-81 until the I-690 interchange in Downtown Syracuse. Finally, Cortland County residents, coming from the south, are the most likely residents to use the section of the I-81 viaduct in question for replacement; namely the 1.4 mile section from the southern I-481 interchange up to the I-690 interchange in Downtown Syracuse.

Within Onondaga County we must also acknowledge the dominance of traveling by personal vehicles and the continued reliance on the interstate for commutes. Again, the towns in the southern portion of the county (Fabius, Lafayette, Marcellus, Otisco, Pompey, Skaneateles, Spafford, and Tully) are the most likely to use the portion of the I-81 viaduct in question.

View fullsize 2007 Employment Density
2007 Employment Density
View fullsize 2035 Employment Density
2035 Employment Density
Source: U.S. Census Bureau, 2013-2017 American Community Survey 5-Year Estimates

Source: U.S. Census Bureau, 2013-2017 American Community Survey 5-Year Estimates

These counties and towns are significantly less diverse racially and economically compared to the City of Syracuse. This diversity is important to consider due to the history of I-81’s current footprint, which resulted in the destruction of a majority African American neighborhood (Haas). As of 2017, the census tracts located directly adjacent to I-81 are predominantly Black or African American with poverty concentrations of up to 63% (U.S. Census Bureau). Onondaga County as a whole is predominantly white with relatively low levels of poverty (see maps below), as are the surrounding counties.

Screen Shot 2019-03-08 at 4.54.11 PM.png
Screen Shot 2019-03-08 at 4.56.33 PM.png
Screen Shot 2019-03-08 at 4.54.39 PM.png
Screen Shot 2019-03-08 at 4.57.06 PM.png

The I-81 Viaduct

With the I-81 viaduct having reached the end of its useful life in 2017, we must consider the alternatives with respect to the socioeconomic differences within the region to find the solution that best promotes equity amongst residents. The three current options include:

  1. Rebuild the viaduct up to modern federal DOT standards ($1.7 billion)

  2. Replace the highway with an improved street grid while sending through traffic along I-481 outside the city; known as the community grid ($1.3 billion)

  3. Build a tunnel through the city with elements of the community grid plan on top of the tunnel footprint; known as the hybrid option ($3.6 billion) (Hannagan).

The 1.4 mile section of the viaduct in question runs from the southern edge of Syracuse north until the I-690 interchange. To the east of the highway is Syracuse University and SUNY Upstate Medical Campus, two of the largest employers in Central New York. To the west of the highway resides a mixture of low-income and public housing that reach to the edge of Downtown Syracuse. The viaduct’s footprint runs directly through the former 15th Ward, a predominantly African American neighborhood that was deemed uninsurable for federally backed mortgages during red lining (see Red Lining map below).

Syracuse Red Lining Map from 1937

Syracuse Red Lining Map from 1937

During the original planning for I-81, African American residents found themselves segregated to the 15th Ward, with many realtors refusing to show suburban houses to them. This resulted in a neighborhood that was three times as dense as the rest of the city, including numerous buildings falling below safety codes. The state saw the interstate system as a form of  slum clearance and a way to bolster housing demand (Haas). The mayor at the time, Anthony Henninger, believed that the highway would box in the downtown area and strangle the growth of the city (Croyle). Many others believed the growth of the suburbs would help propel growth in Syracuse as well. Instead, many businesses along South Salina St. have closed, or were torn down to be replaced by gas stations, while the suburbs have continued to expand. Housing options were limited for African Americans, resulting in many being forced into newly constructed public housing (Haas). In this way, I-81 has always had unequal effects on the community depending on who you are and where you are from.

While the bulk of the construction will be centered in the City of Syracuse, the effects of the chosen plan will be felt throughout the region, just as the original plan was. On that note, there are a few major concerns that residents and elected officials have raised.

Access to Community Resources

The first concern to many residents is how each proposal will affect their accessibility. Syracuse has relatively short commute times compared to most of the country. Many suburban residents are concerned that their commutes will be drastically longer should the community grid option be chosen. Documents released from a preliminary Draft Environmental Impact Statement (DEIS) from 2016 show most commutes would be more or less unchanged when comparing the community grid to current conditions (New York State Department of Transportation. “Alternatives.”).

For those living in Dewitt along I-481, there has been concern about the increased usage of the route as thru-traffic would be rerouted around Syracuse, including truck routes (Magnarelli). As part of the mitigation plans, I-481 would see improvements that would likely include sound barriers, to counteract any increase in traffic.

Hotel owners just north of Syracuse are concerned about the loss of business due to the removal of the highway, noting that 20% of their guests do not have reservations when they arrive (Lohmann, “I-81 Voices…”). In his town hall on the subject, Representative John Katko (R-Camillus) reassured the hotel owners that they would still be located off of I-90, which would still bring in travelers.

One group, Save 81, has focused on proving that the community grid cannot support the traffic that heads into Syracuse each day. They have warned that over 100 intersections would see their level of service drop a full level, including 61 that would rank as an E or F (Lohmann, “I-81 Grid Opponents…”). While these concerns are valid, most level drops will be negligible. In Syracuse, most roads are rated with very high levels of service, A’s or B’s. Dropping from an A to a B would go unnoticed by most drivers (Lohmann, “I-81 Grid Opponents…”).

On the other hand, the current viaduct and its replacement do not provide adequate access for the communities directly beside it. While many will argue that residents can walk underneath the viaduct to reach employment opportunities on the other side, the street network below the viaduct is dark, cluttered, and unfriendly to pedestrians. A revamped viaduct would be taller, allowing for more sunlight to reach beneath it, but would not solve the problem of high traffic volumes funneling towards the on-ramps.

Source: I-81 Independent Feasibility Study November 2017 by WSP

Source: I-81 Independent Feasibility Study November 2017 by WSP

The Orange tunnel option, the preferred tunnel path, would seem to appease both residents needing improved pedestrian access and suburban commuters concerned about having high speed access through the city. Ultimately, the plan would not provide any exits from when it initially goes underground until it reemerges at the I-690 interchange (see map above). This configuration would result in a large portion of the commuter traffic to opt for the street grid to reach their destinations, removing any benefit of high speed travel for commuters.

Safety

Along with accessibility, many worry about the safety of their communities. The preliminary DEIS produced estimates on different types of vehicular accidents at peak hours to compare the effectiveness of their safety measures (see Table 2). The preliminary DEIS did not compared any of the tunnel options due to the plans being deemed inappropriate for the scope of this project. The results show dramatically lower accident totals for the community grid when compared to the current highway and the new viaduct design. This is mostly attributed to slower speeds and the street design.

Source: New York State Department of Transportation. I-81 Viaduct Project: Draft Environmental Impact Statement and Draft Section 4(F) Evaluation (Preliminary)

Source: New York State Department of Transportation. I-81 Viaduct Project: Draft Environmental Impact Statement and Draft Section 4(F) Evaluation (Preliminary)

Safety goes beyond vehicle accidents. Neighbors who live directly beside the highway are exposed to high levels of toxins from exhaust fumes that often lead to persistent asthma in children. While these cases have seen a decrease over the last two decades, most likely due to improved fuel efficiency and increased regulations, there is still a strong link between living beside highways and asthma rates (Khreis). Researchers have shown that poorly controlled asthma can lead to more frequent absences in school and lower grades overall. Many of these students live in poor neighborhoods without access to healthcare that can help prevent chronic asthma (Preidt).

Neighbors in Dewitt along I-481 are right to be concerned with the emissions from increased traffic but their neighborhoods are more sparsely populated and are at an increased distance from the highway (see maps below). I-81 currently sits directly above some of the most impoverished neighborhoods in the region, resulting in their children underperforming in school due to absences and health issues, creating a cycle that goes unbroken.

View fullsize 2007 Household Density
2007 Household Density
View fullsize 2035 Household Density
2035 Household Density

The tunnel option, while removing cars from the surface, will continue to release exhaust fumes into these same low-income neighborhoods through its ventilation system. To maintain clean air within the tunnel, large ventilation plants would need to be constructed to pump out the exhaust. These plants are often placed in low-income neighborhoods and placed without concern for how they visually impact their surroundings (“Vent Buildings…”).

Taxable Property/ Economic Impact

Syracuse, like many central cities, struggles with an abundance of tax-exempt land. Over half of the land in the city is off of the tax rolls; including Syracuse University, SUNY Upstate Medical Campus, churches, government buildings, parkland, etc. (Lohmann, “If ‘Community Grid’ Replaces...”). As we know from research from Dreier, et al (“What Can Motown…”), central cities have felt an increasing burden to provide services from federal and state mandates without financial support. With property taxes as one of the only financial levers city governments have to raise funds, this abundance of tax exempt lots creates an added stress to an already financially strapped city.

City residents are rightfully concerned with the retention of tax paying properties through this reconstruction project. Rebuilding the viaduct up to current DOT standards would result in a wider, taller structure with a straighter course. This new path would require the destruction of 24 buildings, including some historic structures. The community grid and the tunnel would require far fewer demolitions; five and twelve, respectively (Hannagan).

On top of preserving structures, the community grid and the tunnel, to a lesser extent, will open up land for development. If the community grid is chosen, the removal of the viaduct will free up over 18 acres of land. This land could generate up to $33 million in tax revenue every year for the city (Lohmann, “If ‘Community Grid’ Replaces...”). The tunnel would allow for slightly less development due to the structure of the tunnel preventing construction of supports for buildings on the surface (WSP), but ultimately would create room for new development.

While the tunnel offers opportunities for new development, the benefits are offset by the estimated $10 million in maintenance costs per year. This includes running pumps to remove salt water and around the clock monitoring (Lohmann, “I-81 Tunnel…”). Some have offered up the idea of paying tolls to use the tunnel, but that would likely reduce usage to a point where the high speed access is unnecessary (Lohmann, “I-81 Voices…”).

Recommendations

Based on the information provided, I must recommend that the New York State Department of Transportation move forward with the community grid option. The current viaduct, and any other future high speed route through the city, acts as a physical barrier to marginalized communities directly adjacent to its path. The community grid offers an opportunity to remove the barrier, improve pedestrian and public transit connections to the neighborhood, and encourage private investment on the newly usable land. Beyond choosing the community grid, there are three specific policies that must be in place to ensure that the growth spurred by this development is equally shared.

Enhance Public Transit/ Implement Bus Rapid Transit (BRT)

With large percentages of residents adjacent to the viaduct having no access to a private vehicle, providing improved public transit service is vital to increasing accessibility. While residents live within close proximity to a high concentration of employment opportunities, many require advanced education and skills. Low-skill work has moved outside of the city, requiring longer commutes for residents and prompting some employers to overlook city residents for these opportunities (“Ending Spatial…”). This is a trend that researchers have noticed time and again; applicants being characterized due to the address on their application, not based on their skills and knowledge (Squires, 53-53).

As part of the funding for the community grid, there should be additional funding put in place to expand bus service as well as develop BRT routes through the city. The Syracuse Metropolitan Transportation Council (SMTC) has already developed plans for two BRT routes through the city, connecting many low income neighborhoods with employment and education centers. The plan would cost $30 million to build out and $8 million a year to run the service (Abbott). This funding is more than CENTRO, the local transit authority, is able to come up with on its own, but is a fraction of the price difference between the community grid and a rebuilt viaduct. Funding BRT through Syracuse would help improve accessibility for the least mobile residents in the region.

Screen Shot 2019-05-10 at 12.23.27 PM.png

Return Uncovered Land to the City/ Build Affordable Housing

As previously mentioned, the community grid would free up over 18 acres of land for redevelopment. Due to this project being conducted by the state, the land would still be under state ownership when the viaduct is removed. It is within New York DOT standard practices to return all land not needed for future transportation purposes back to the city (Lohmann, “If ‘Community Grid’ Replaces...”). The city should first look for opportunities to build affordable housing on the newly acquired land.

This construction should be tied to the Blueprint 15 plan to rebuild affordable and mixed-income housing on the current sites of Pioneer Homes, McKinney Manor, and Central Village. These public housing communities are the oldest in New York State and offer substandard living conditions for residents. The Blueprint 15 plan calls for the demolition and reconstruction of the entire neighborhood with an aim of mixing low-income housing with attracting private commercial development (Eisenstadt). The city should require that the newly uncovered land be used as the beginning of this development. Building housing on the new land first and giving priority to public housing residents before beginning the demolition of the old structures. Mixed in with the new low-income housing should be private development that will help bolster the city’s tax base. This land should not go to the universities in the area, but instead tax-paying developers that are willing to commit to providing affordable housing.

Connect Residents with Employment Spurred by Construction

The final piece is the requirement that residents located adjacent to the viaduct should be in line for employment on this project. This may require an apprenticeship program for construction workers, training for positions as a bus operator, or maintenance positions on the newly constructed housing units. Without an employment guarantee for local residents, they will not be able to fully share in the economic stimulus that comes with a project of this size. Teaching residents the skills necessary to participate in the project will also provide them opportunities long after the construction is complete. We must look to use state funding to improve the lives of citizens beyond a single infrastructure project.

The proposed Community Grid design

The proposed Community Grid design


Works Cited/ Bibliography

  • Abbott, Ellen. “Could 'Bus Rapid Transit' change the way central New Yorkers get around?” WRVO, Nov. 13, 2017, https://www.wrvo.org/post/could-bus-rapid-transit-change-way-central-new-yorkers-get-around. Accessed April 26, 2019

  • Advanced Media NY Editorial Board. “Let’s Unite Syracuse: Replace I-81 with Community Grid.” The Post Standard, July 29, 2018, /www.syracuse.com/opinion/2018/07/lets_unite_syracuse_replace_i-81_with_a_community_grid_editorial. Accessed March 8, 2019

  • Centerstate CEO. Community Grid Plus: Expanding the I-81 Conversation Beyond the Highway, Feb. 22, 2019, http://www.centerstateceo.com/sites/default/files/Community%20Grid%20Plus_Web.pdf. Accessed April 15, 2019

  • CNY Fair Housing Council. Mapping Economic, Educational, & Housing and Neighborhood Opportunity in Onondaga County & Syracuse, NY, Prepared by Alys Mann, Alys Mann Consulting, May 2014, pp. 17, 20, 21, 31, 34, 35.

  • Congress of New Urbanism. “I-81: Syracuse, New York.” Freeways Without Futures, 2019, https://www.cnu.org/sites/default/files/FreewaysWithoutFutures_2019.pdf. Accessed April 15, 2019

  • Croyle, Jonathan. “Throwback Thursday: Editorials, Syracuse Mayor Condemn Elevated I-81 in 1958.” The Post Standard, April 13, 2017, https://www.syracuse.com/vintage/2017/04/throwback_thursday_editorials_and_mayor_warn_about_elevated_highways.html. Accessed April 22, 2019

  • Dreier, Peter, Mollenkopf, John, and Swanstrom, Todd. “City Limits: What Can Motown Teach Us about Wealth, Poverty, and Municipal Finance?” Place Matters: Metropolitics for the Twenty-First Century, 2014, pp. 175-191

  • Eisenstadt, Marnie. “$100 Million Plan Would Turn Syracuse Public Housing into Neighborhood for All.” The Post Standard, Feb. 15, 2019, https://www.syracuse.com/news/2019/02/exclusive-100-million-plan-would-turn-syracuse-public-housing-into-neighborhood-for-all.html. Accessed April 26 2019

  • “Ending the Spatial Mismatch in Syracuse.” In the Salt City, April 1, 2019, https://inthesalt.city/2019/04/01/endingthespatialmismatchinsyracuse/. Accessed April 26, 2019

  • Grimm, Sergei. Map of the City of Syracuse, New York, Dec. 1937, http://mediad.publicbroadcasting.net/p/waer/files/styles/x_large/public/201712/SWAER17121813070_0001_1.jpg. Accessed April 19, 2019

  • Haas, David. “I-81 Highway Robbery: The Razing of Syracuse’s 15th Ward.” Syracuse New Times, Dec. 12, 2018, www.syracusenewtimes.com/highway-robbery-5-decades-ago-syracuse-neighborhoods-were-razed-to-construct-interstate-81/. Accessed March 8, 2019

  • Hannagan, Charley. “Experts Share Why They Believe NY will Tear Down I-81, Put Traffic on Syracuse Streets.” The Post Standard, Oct. 27, 2016, www.syracuse.com/news/2016/10/signs_point_to_demolishing_i-81_and_putting_traffic_on_syracuse_streets. Accessed March 8, 2019

  • Khreis, Haneen. “Mapping Where Traffic Pollution Hurts Children Most.” City Lab, April 15, 2019, https://www.citylab.com/environment/2019/04/mapping-where-traffic-air-pollution-hurts-children-most/587170/. Accessed April 15, 2019

  • Lohmann, Patrick. “Grid or No Grid? See Where Groups, Politicians, Others Stand on I-81’s Future.” The Post Standard, July 29, 2018, www.syracuse.com/news/2018/07/grid_tunnel_or_rebuild_see_where_groups_officials_stand_on_i-81s_future. Accessed March 8, 2019

  • Lohmann, Patrick. “I-81 Grid Opponents Warn of Congestion, so Why Don’t They Release the Proof?” The Post Standard, March 13, 2019, https://www.syracuse.com/news/2019/03/i-81-grid-opponents-warn-of-congestion-so-why-dont-they-release-the-proof.html. Accessed April 21, 2019

  • Lohmann, Patrick. “I-81 Tunnel: Project Would Take up to $4.5 Billion, 10 Years, Long-Awaited Study Says.” The Post Standard, Dec. 4, 2017, https://www.syracuse.com/news/2017/12/long-awaited_study_i-81_tunnel_feasible_but_costly.html#incart_breaking. Accessed April 21, 2019

  • Lohmann, Patrick. “I-81 Voices: Truckers, Motel Owners, Suburbanites; Would You Pay a Toll for a Tunnel?” The Post Standard, Feb. 20, 2019, https://www.syracuse.com/news/2019/02/heres-four-perspectives-on-i-81-from-katkos-third-town-hall.html. Accessed April 21, 2019

  • Lohmann, Patrick. “If ‘Community Grid’ Replaces Interstate 81 in Syracuse, What will Happen to the Land?” The Post Standard, Nov. 12, 2018, www.syracuse.com/news/2018/11/grid_land_i-81_dot. Accessed March 8, 2019

  • Magnarelli, Tom. “Trucking Concerns Among Top Issues at Katko’s I-81 Town Hall in Auburn.” WRVO, Feb. 5, 2019, www.wrvo.org/post/trucking-concerns-among-top-issues-katko-s-i-81-town-hall-auburn Accessed March 8, 2019

  • New York Civil Liberties Union. “The I-81 Story.” NYCLU, https://www.nyclu.org/en/campaigns/i-81-story?fbclid=IwAR3fUp5vseeA6aGQk1lyW4mp3nZovNXoT-XGW-9dT2YD5E-EvUc6U2y9ruw. Accessed April 15, 2019

  • New York State Department of Transportation. “Alternatives.” I-81 Viaduct Project: Draft Environmental Impact Statement and Draft Section 4(F) Evaluation (Preliminary), Dec. 2016, http://graphics.advancemediany.com/2019/deis/05_Transportation_and_Engineering_Considerations_12-23-2016.pdf. Accessed April 15, 2019

  • New York State Department of Transportation. “Social, Economic, and Environmental Considerations.” I-81 Viaduct Project: Draft Environmental Impact Statement and Draft Section 4(F) Evaluation (Preliminary), Dec. 2016, http://graphics.advancemediany.com/2019/deis/05_Transportation_and_Engineering_Considerations_12-23-2016.pdf. Accessed April 15, 2019

  • New York State Department of Transportation. “Transportation and Engineering Considerations.” I-81 Viaduct Project: Draft Environmental Impact Statement and Draft Section 4(F) Evaluation (Preliminary), Dec. 2016, http://graphics.advancemediany.com/2019/deis/05_Transportation_and_Engineering_Considerations_12-23-2016.pdf. Accessed April 15, 2019

  • Preidt, Robert. “Poor Asthma Control Can Mean Worse Grades for Kids.” WebMD, March 11, 2019, https://www.webmd.com/asthma/news/20190311/poor-asthma-control-can-mean-worse-grades-for-kids. Accessed April 21, 2019

  • Squires, Gregory D. and Kubrin, Charis E. “Privileged Places: Race, Uneven Development and the Geography of Opportunity in Urban America,” Urban Studies, Vol. 42, No. 1, January 2005. Pp 47-68

  • Steuteville, Robert. “Time to Restore the Grid.” Public Square: A CNU Journal, April 9, 2019, https://www.cnu.org/publicsquare/2019/04/09/time-restore-grid?fbclid=IwAR3TlrAsSlSnprQ1cOMdQSrMOqt5tPMCmBJ3INlcADpk-2S-ypvI2QxX58I. Accessed April 15, 2019

  • Syracuse Metropolitan Transportation Council. SMTC Travel Demand Model, Prepared by Resource Systems Group, Inc.Version 3.023, April 2012, pp. 22, 23, 25, 26. http://thei81challenge.org/cm/ResourceFiles/resources/SMTC%20Model%20Version%203.023%20Documentation.pdf Accessed March 8, 2019

  • U.S. Census Bureau, 2013-2017 American Community Survey 5-Year Estimates

  • “Vent Buildings Spark Controversy.” Boston.com, 2003, http://graphics.boston.com/traffic/bigdig/vents.htm. Accessed April 21, 2019

  • WSP. I-81 Independent Feasibility Study, November 2017, https://www.scribd.com/document/366284718/I81-Independent-Feasbility-Study-Report-Nov2017#from_embed?campaign=SkimbitLtd&ad_group=126006X1587360Xa05b94d808e88f2bed9fbf8c418f69e5&keyword=660149026&source=hp_affiliate&medium=affiliate. Accessed April 21, 2019

In Syracuse, Transportation, Urban Planning
Comment
← Newer Posts Older Posts →

Recent posts

Featured
PXL_20250830_182821521.jpg
Sep 15, 2025
Urbanism Lessons from the Great White North
Sep 15, 2025
Read More →
Sep 15, 2025
Carousel.jpg
May 27, 2025
Destiny USA and the City
May 27, 2025
Read More →
May 27, 2025
PXL_20240805_141743149.jpg
Jan 1, 2025
All Cities Are Beautiful
Jan 1, 2025
Read More →
Jan 1, 2025
PXL_20241005_135224129.jpg
Nov 6, 2024
A Healthy Future for the Regional Market
Nov 6, 2024
Read More →
Nov 6, 2024
PXL_20240728_191254239.jpg
Jul 31, 2024
Renters Matter, Too
Jul 31, 2024
Read More →
Jul 31, 2024
Vista view.jpeg
Mar 21, 2024
The Valley of the Sun - A Land of (Sub)Urban Extremes
Mar 21, 2024
Read More →
Mar 21, 2024
Manlius Cinema.jpeg
Jan 31, 2024
The Movie Theater at the Urban Core
Jan 31, 2024
Read More →
Jan 31, 2024
Clinton Square Christmas Tree at night.jpeg
Nov 30, 2023
The Case for a Holiday Village
Nov 30, 2023
Read More →
Nov 30, 2023
PXL_20230817_220739294.jpg
Oct 31, 2023
The Walk: To Middle Ages
Oct 31, 2023
Read More →
Oct 31, 2023
Ballpark.jpeg
Sep 7, 2023
The Walk: To the Ballpark
Sep 7, 2023
Read More →
Sep 7, 2023
PXL_20230813_213112525.jpg
Aug 14, 2023
The Walk: To Tipperary Hill
Aug 14, 2023
Read More →
Aug 14, 2023
Arts and Crafts Festival 2023.jpeg
Jul 31, 2023
The Walk
Jul 31, 2023
Read More →
Jul 31, 2023

Powered by Squarespace